How-to — 6 min read
Small business trends to watch in 2026
The start of the year is always a vital time for small businesses. It brings opportunities to fine-tune your strategy,…
Setmore’s New Year’s resolution for 2018 is to help you make more money. But before we can do that, first we have to see how much you made last year, so we can measure our progress. Alternatively, if you need a way to find your total revenue from 2017 for tax purposes, this is the guide for you.
Please note, in order for this to work, you’ll need to have had either the Stripe payments integration or the Setmore Cash Register system activated in your account. You’ll also need to have tracked all payments (for both appointments and classes) in Setmore through the entirety of 2017.
If you didn’t track payments in Setmore through 2017, then now is a great time to get started for 2018!
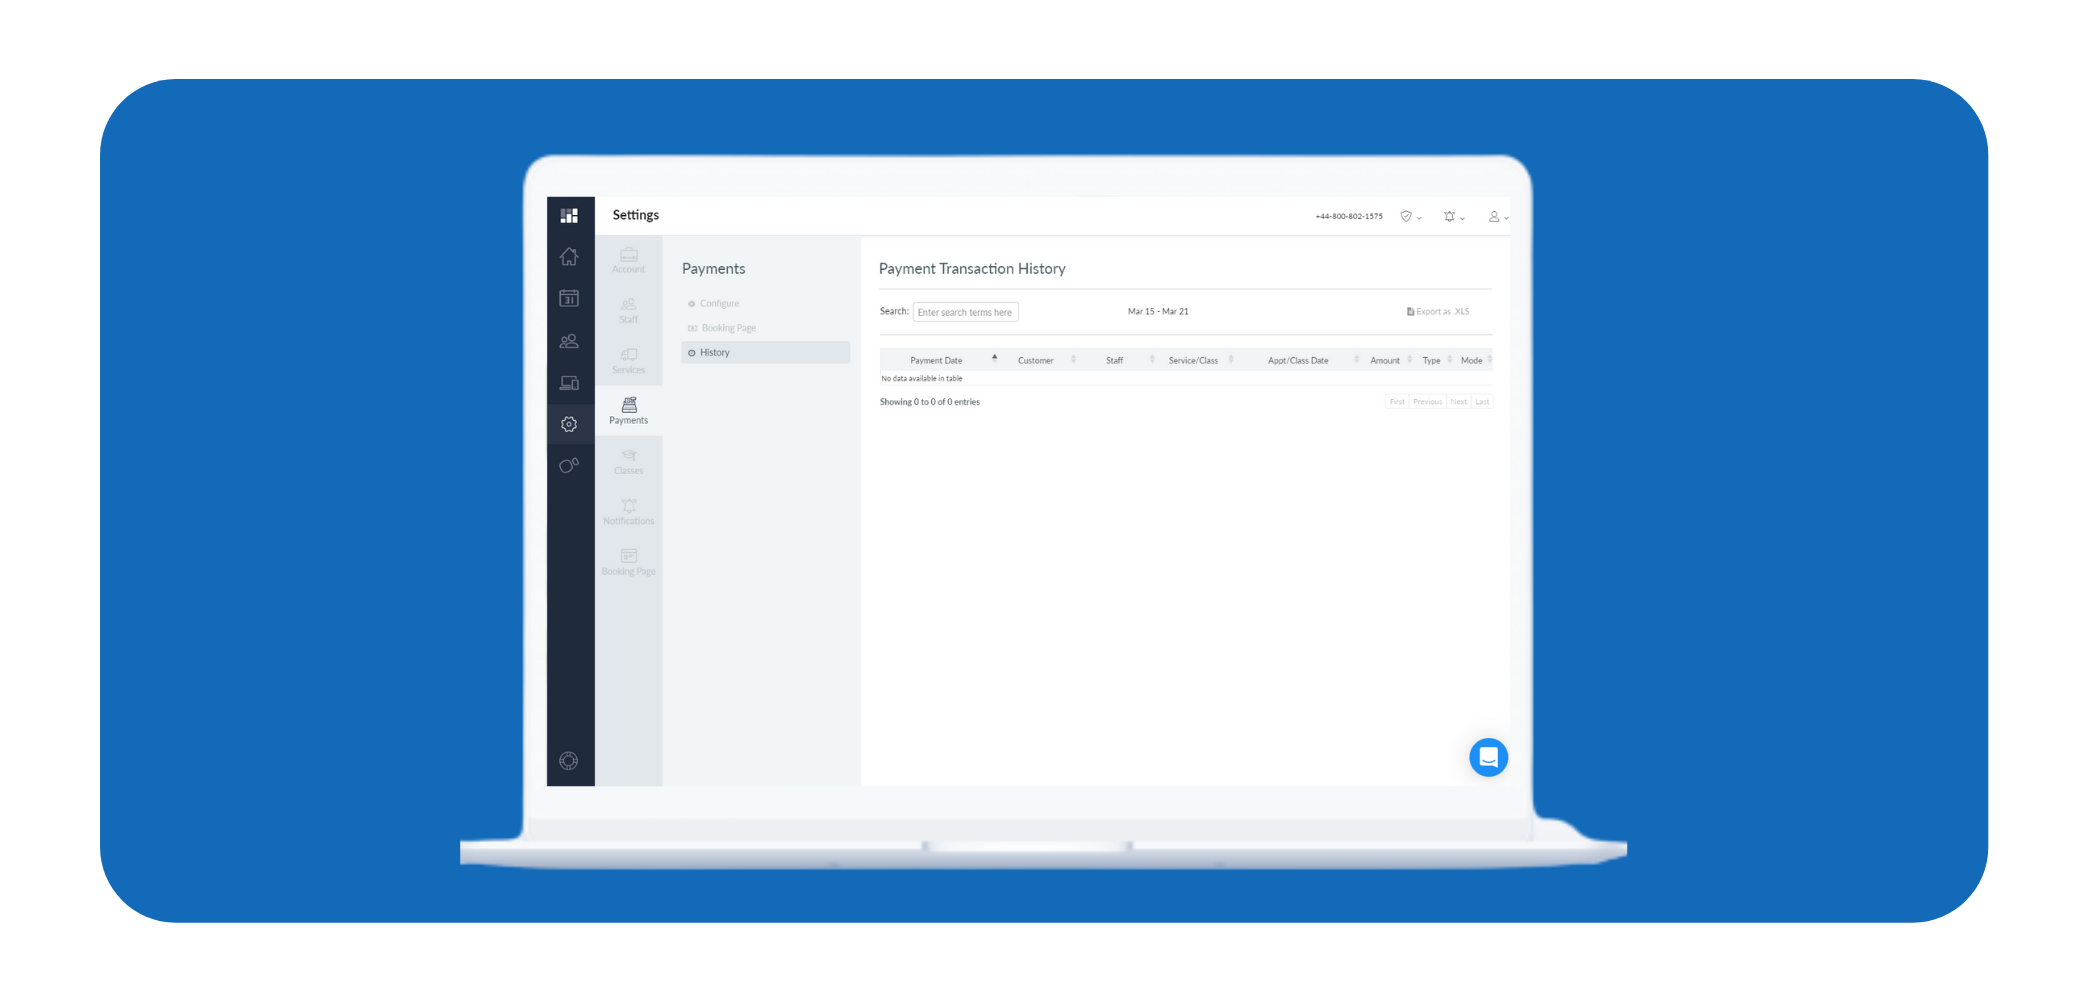
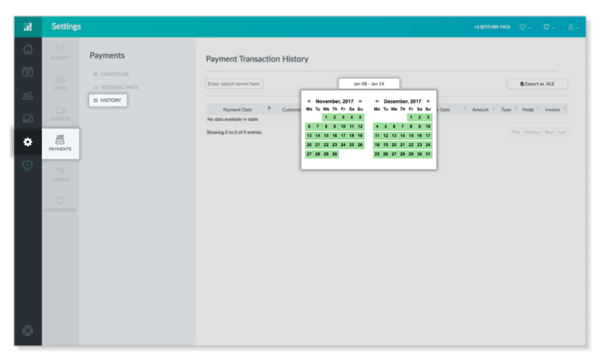
Setmore lets you easily look up your past payment history over a custom date range. To get started, navigate to Settings > Payments > History.
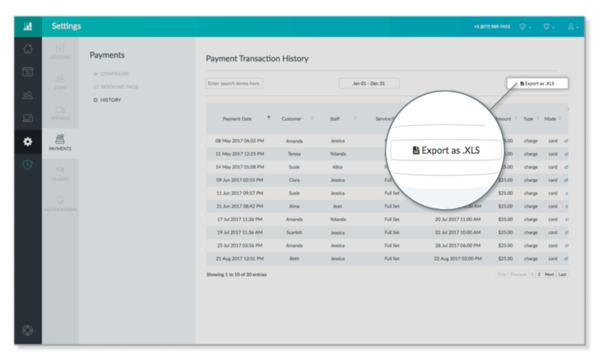
For the next step, you’ll need to open the .XLS file with your preferred spreadsheet software. Don’t have spreadsheet software? No worries – you can use Google Sheets, which comes free with any Gmail or Google account. Learn how to import a .XLS file to Google Sheets >
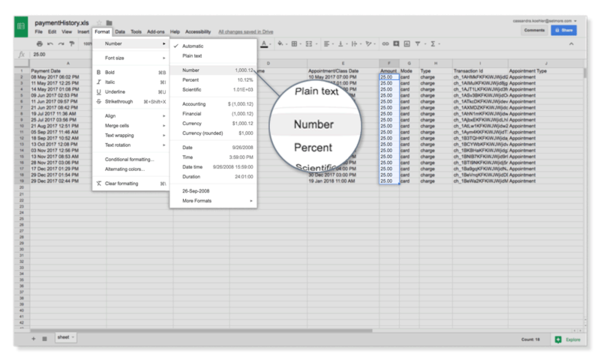
Before we begin, you’ll need to verify that all data in the “Amount” column is formatted as a numerical value. This basically means that the software in question will recognize dollar amounts as a number, rather than as text, which the software won’t be able to sum.
If at any point during the year you issued a refund for a service or a charge already levied on a customer, then you’ll need to take one additional step to ensure that these values don’t inflate your overall total revenue.
Unfortunately, Setmore tracks refund values in the same column as “charges,” which means they’ll get totaled together. To prevent this, we’ll need to convert the positive refund values into negatives, so they’ll cancel out the original charge and your total revenue will be accurate.
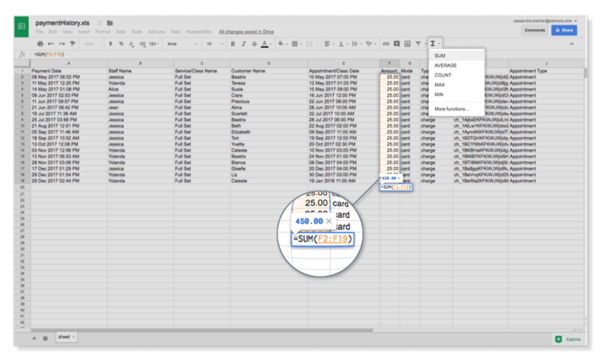
You’re now ready to find the sum total revenue for all your 2017 appointments.
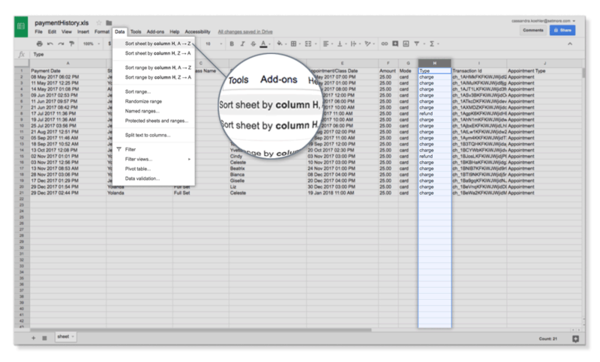
You can continue to shuffle the data based on different sorting actions to unlock some insights about your business:
Busiest staff member – Sort by the Staff column. Whichever staff member name occurs most often is your busiest staff member. Whichever staff has the highest sum total revenue is your highest earning staff member.
Most popular service – Sort by the Services column. Whichever service occurs most often is your most popular one. Whichever service has the highest sum total revenue is your highest earner.
Best returning customer – Sort by the Customer Name column. Whichever customer name occurs most frequently is your most regular customer. Whichever customer name generates the highest sum total revenue is your business’ new best friend.
Have any tricks of your own for tracking your revenue and growth in Setmore? Post a comment below to help educate others!
In the meantime, start logging your customer payments and make sure 2018 is a blast.
Thanks,
Team Setmore

by Cassandra
Writer, editor and scheduling product expert at Setmore Appointments.


The start of the year is always a vital time for small businesses. It brings opportunities to fine-tune your strategy,…

Many small service-based businesses start with one goal: to help people. But over time, the behind-the-scenes demands start to stack…

Business owners, this one’s for you. Ever thought, “I need something that works with my existing tools, saves me time,…
